Water Meter Node
The Node is the device that hears your water meter. It's an ESP32 with a 900 MHz FSK radio that locks onto the utility meter you own, decodes its readings, shows that one meter on a built-in dashboard, and forwards each new reading to the Gateway over a low-power 433 MHz mesh.
It's designed to be drop-in: the firmware autodetects whether the radio is an SX1276 or SX1262, runs a small AP fallback so you can always reach the setup page, and updates over the air from any browser, including iPhone. By design it surfaces only your default meter; see Privacy and liability below.
What it does, in plain English
Utility water meters transmit a small radio packet a few times a minute reporting their cumulative volume. The Node tunes to that signal, validates the CRC, looks up the meter in its memory by serial number, and updates the volume reading. If the volume went backwards or didn't move, the reading is suppressed. Otherwise it gets forwarded to the Gateway and shown on the dashboard.
The Node is bound to one default meter, the meter you own. Even though the radio can hear other meters in range, normal operation shows, emails, and forwards only that one (see Privacy and liability).
Three different meter protocols are supported, covering a range of utility meters deployed in U.S. utilities since the mid-2000s. The Node picks the right one based on its /setup configuration.
Privacy and liability: the Node works on your meter
The 900 MHz band these meters use is shared, so any receiver in range can physically demodulate nearby utility meters, not just one. That is a liability question as much as a technical one: whoever runs the Node should not be collecting, displaying, or transmitting a neighbor's consumption data.
So the Node is bound to a single default meter: the meter owned by the utility customer who installs the Node. In normal operation the dashboard, the JSON API, the email reports, and the mesh upload to the Gateway all surface only that one meter. Everything else the radio happens to hear is withheld at the source. The filter is server-side on the device, not cosmetic page-hiding, so it holds for scripts and agents hitting the API too.
The full list of in-range meters and the radio internals are reachable only in debug mode, which is gated by the access-point password and lives in RAM only: it is off at every boot and after any power loss. There is no persistent "see everything" switch to leave on by accident.
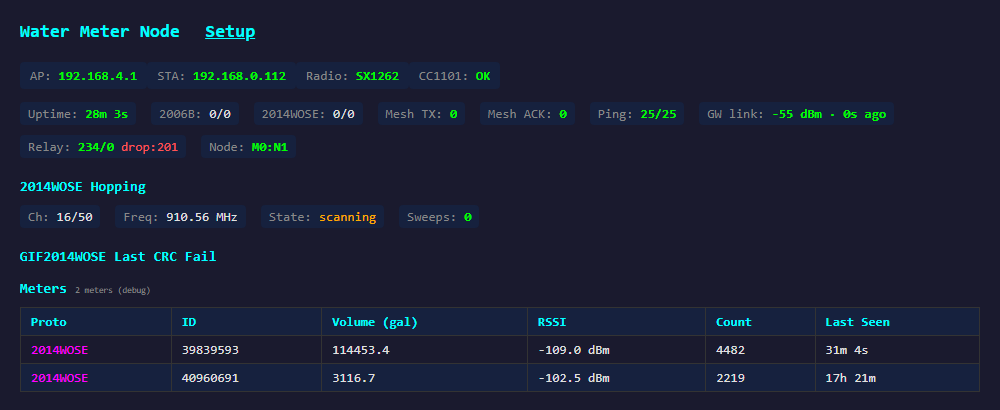
Same Node, same minute; the only difference is the debug flag. The frequency-hopping engine (the "2014WOSE Hopping" block) and the per-protocol decode counters are likewise debug-only diagnostics. The owner's normal view stays scoped to a single meter.
Key features
- Privacy by default. Bound to a single default meter, the one you own. The dashboard, API, email reports, and mesh upload surface only that meter; every other in-range meter is withheld server-side. A full view requires debug mode, which is access-point-password gated and RAM-only (off after every reboot). See Privacy and liability.
- Two FSK radios, one firmware. Detects whether the attached chip is an SX1276 (older LoRa module) or SX1262 (newer, ~16 dB more sensitive) at boot. No build-time choice. On the SX1262 it also auto-detects the clock source, falling back from TCXO to a plain crystal if the oscillator doesn't start, so both TCXO and crystal-clocked SX1262 modules (such as a Waveshare Core1262-HF drop-in) just work without a separate build.
- Three meter families. GIF2006B (fixed 916.45 MHz, 100 kbps), GIF2014W-OSE (50-channel frequency hopping across 904.9–924.5 MHz), and GIF2020OCECNA (200 kbps).
- CC1101 mesh client. Every reading the Node decodes is forwarded back to the Gateway over a separate 433 MHz CC1101 link, with multi-hop relay and ACKs.
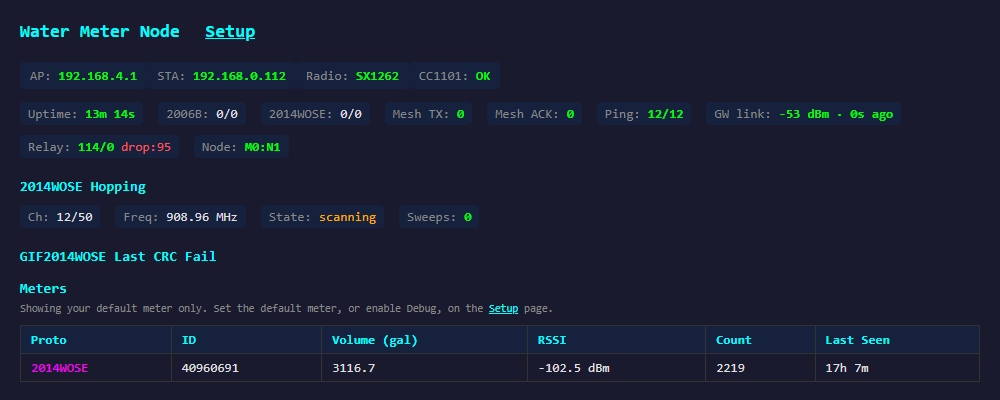
- Embedded live dashboard. Your default meter's volume, RSSI, packet count and last-seen, plus a real-time view of GIF2014W-OSE frequency-hopping state. The full per-meter table appears only in debug mode.
- Diagnostic forensics. Last CRC-fail dump (raw FIFO + decoded bytes), per-protocol decode/CRC/stale counters, sweep logs, all built in for field troubleshooting under debug mode.
- Email reports. Configurable daily / weekly / monthly summaries via Zoho, with per-meter baseline tracking. Sent to every configured recipient, one message per address so recipients never see each other.
- OTA updates. Drop a new
.binfile on/updatefrom any browser, including iPhone Safari (seeIPhoneOTA.mdin the repo). - Local data reset. A password-gated "Clear Meter Data" button on
/setupwipes the stored meter table (RAM and flash) on demand, keeping your settings; no gateway command needed. - Always-on setup AP. Falls back to its own 192.168.4.1 access point if WiFi credentials are unset or wrong, so it's never permanently bricked by a typo.
- JSON everywhere. All dashboard data is also available at
/api/*as plain JSON for scripts and agents.
Standalone mode: no gateway needed
For small clusters (a single building, a small park, one property), a single Node can be the entire system. It still receives in the band, still surfaces your default meter on its dashboard, still emails that meter's daily report, and still accepts OTA updates. It just doesn't relay anything: the reading lives on the device, visible at its IP on your local WiFi.
The dashboard at the top of this page is exactly this case: one Node at 192.168.0.103 on local WiFi, showing the single meter its owner configured, with no Gateway involved. The Node is reachable directly from any browser on the same LAN; agents and scripts hit its /api/meters endpoint, which returns that same default-meter-only view, without a gateway in the path.
Powering the Node
The recommended hardware installation powers each Node from the 24 V AC supply that's already present in most U.S. residential irrigation controllers. A small inline 24 V AC → 5 V DC converter (with adjustable output to compensate for voltage drop on long cable runs) feeds the ESP32 through its USB-µB or 5 V pin. The Node then lives next to the irrigation valves, on a wire that's already there, and stays online whenever the irrigation system has power.
| Input | 24 V AC, 50/60 Hz, drawn from the irrigation transformer's common bus |
|---|---|
| Output | Adjustable 5–6 V DC at ~500 mA continuous (sized for the Node's ~250 mA peak draw plus cable losses) |
| Why adjustable? | On long runs the converter can be set slightly above 5 V at the source so the Node still sees a clean 5 V at the far end after IR drop |
| Why this matters | No extra wall-wart, no extra outlet; you reuse the wiring that already reaches the valve manifold |
Will it read your meter? Check for the endpoint disk
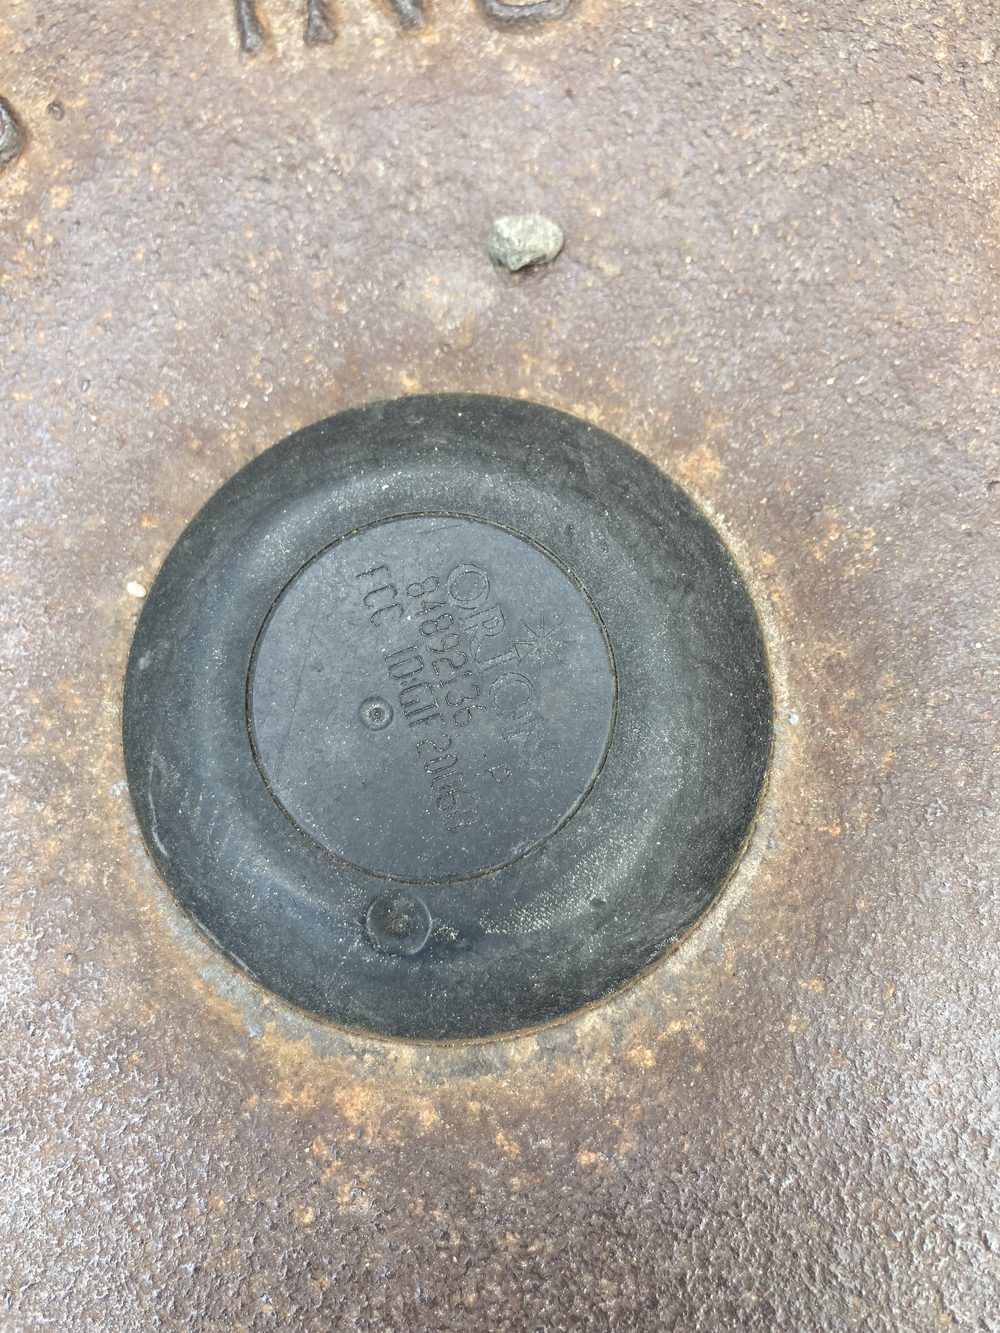
The Node reads a radio endpoint the utility has fitted to the meter, not the dial itself. Before committing to a deployment, confirm the meter you want to read has one. Lift the meter well cover at the property line and look at its center: a readable installation has a round plastic disk (the ORION radio endpoint, marked with an ORION logo and an FCC ID) seated in the middle of the lid, like the one pictured. That disk is what the Node hears over 900 MHz. If the center of the lid is solid metal with no disk, the meter is a non-transmitting type and this system cannot read it as-is.
The other side of the radio: meter protocols
Whichever meter you point it at, the Node runs one of three decoders. GIF2006B is fixed-frequency at 916.45 MHz, 100 kbps. GIF2014W-OSE frequency-hops across 50 channels from 904.9 to 924.5 MHz, and the firmware tracks that hop schedule in real time to stay locked on your meter. GIF2020OCECNA runs at 200 kbps. The hop engine includes a watchdog that follows the default meter specifically: if your meter goes unheard, the Node re-scans all 50 channels rather than camping on a stronger neighbor it happens to hear.
The debug view above exposes this machinery: the "2014WOSE Hopping" block (current channel, frequency, lock or scan state) and a "Last CRC Fail" panel that keeps the most recent raw FIFO and decoded bytes for postmortem. In normal mode none of that is shown; you just see your meter's latest reading.
Specs
| MCU | ESP32 dual-core (Heltec CT62 / WiFi LoRa 32 footprint) |
|---|---|
| FSK radio | SX1276 or SX1262, autodetected at boot (SX1262 clock source, TCXO or crystal, also auto-detected) |
| Mesh radio | CC1101 @ 433.92 MHz, 2-FSK, multi-hop |
| Meter families | GIF2006B, GIF2014W-OSE, GIF2020OCECNA (one at a time) |
| Privacy | Normal mode exposes only the configured default meter (dashboard, API, email, mesh); the full view requires RAM-only, password-gated debug mode |
| Network | WiFi 802.11 b/g/n STA + fallback AP at 192.168.4.1 |
| Power | USB micro 5 V or direct 3.3 V; ~120 mA idle RX, ~250 mA peak TX |
| Firmware | 2.13.15 (observable at /api/diag) |
| OTA | POST /update with the new .bin |
Web endpoints
All endpoints are HTTP on port 80 of the Node's WiFi IP. JSON endpoints return clean structured data; the HTML dashboard pulls from these same routes.
GET / | Live dashboard (meter table, hopping state, mesh counters). |
|---|---|
GET /setup | Configuration page: WiFi credentials, protocol, mesh ID / node ID, email recipients. |
POST /update | Firmware upload (multipart). Works from iPhone Safari. |
GET /api/diag | JSON: uptime, free heap, radio chip, per-protocol decode/CRC counters. |
GET /api/meters | JSON: in normal mode, your default meter only (id, volume in gal, RSSI, count, last seen); the full list requires debug mode. |
GET /api/debug | JSON: current debug-mode flag. POST {"enable":true,"password":"…"} (AP password) to reveal all meters + RF internals; RAM-only, off at next boot. |
POST /api/clear_db | Erase the stored meter table (RAM + flash). {"password":"…"} (AP password) required; returns the number of meters cleared. Default-meter and other config are kept. |
GET /api/config | JSON: current config; POST the same shape to save. |
GET /api/email | JSON: scheduled report config; POST to change interval / recipients. |
POST /api/email/send_now | Trigger an immediate report send (useful for testing SMTP). |
Setup page
The /setup endpoint is a single-page configuration UI served straight from the Node. From here you set WiFi credentials, pick the meter family, switch the GIF2014W-OSE receive mode, toggle metering on/off, and configure email reports, all without re-flashing firmware. This is also where you choose the default meter: the page lists the meters in range and lets you pick the one you own; from then on the public dashboard and reports show only that one. The page itself spells it out: "Pick your meter, then the public dashboard shows only this one."
It's also where you clear the node's stored data. The Clear Meter Data button wipes the entire meter table, both the in-RAM copy and the persisted flash database, so a reboot won't reload it. It's protected by the Debug password and prompts for confirmation, and it leaves your default-meter choice, WiFi, and other settings untouched; the table simply rebuilds as meters are heard again. This lets an owner purge any accumulated readings (including stray non-default meters) directly from the device, with no gateway command needed.
The Passwords section lets you change the device's three independent passwords, all shipping as a factory default: the AP/OTA password that secures the WiFi access point and firmware updates, the Setup password for this configuration login, and the Debug password that gates debug mode and Clear Meter Data. A one-click reset returns all three to the factory default using the current AP password, so a forgotten setup or debug password is never a lock-out.
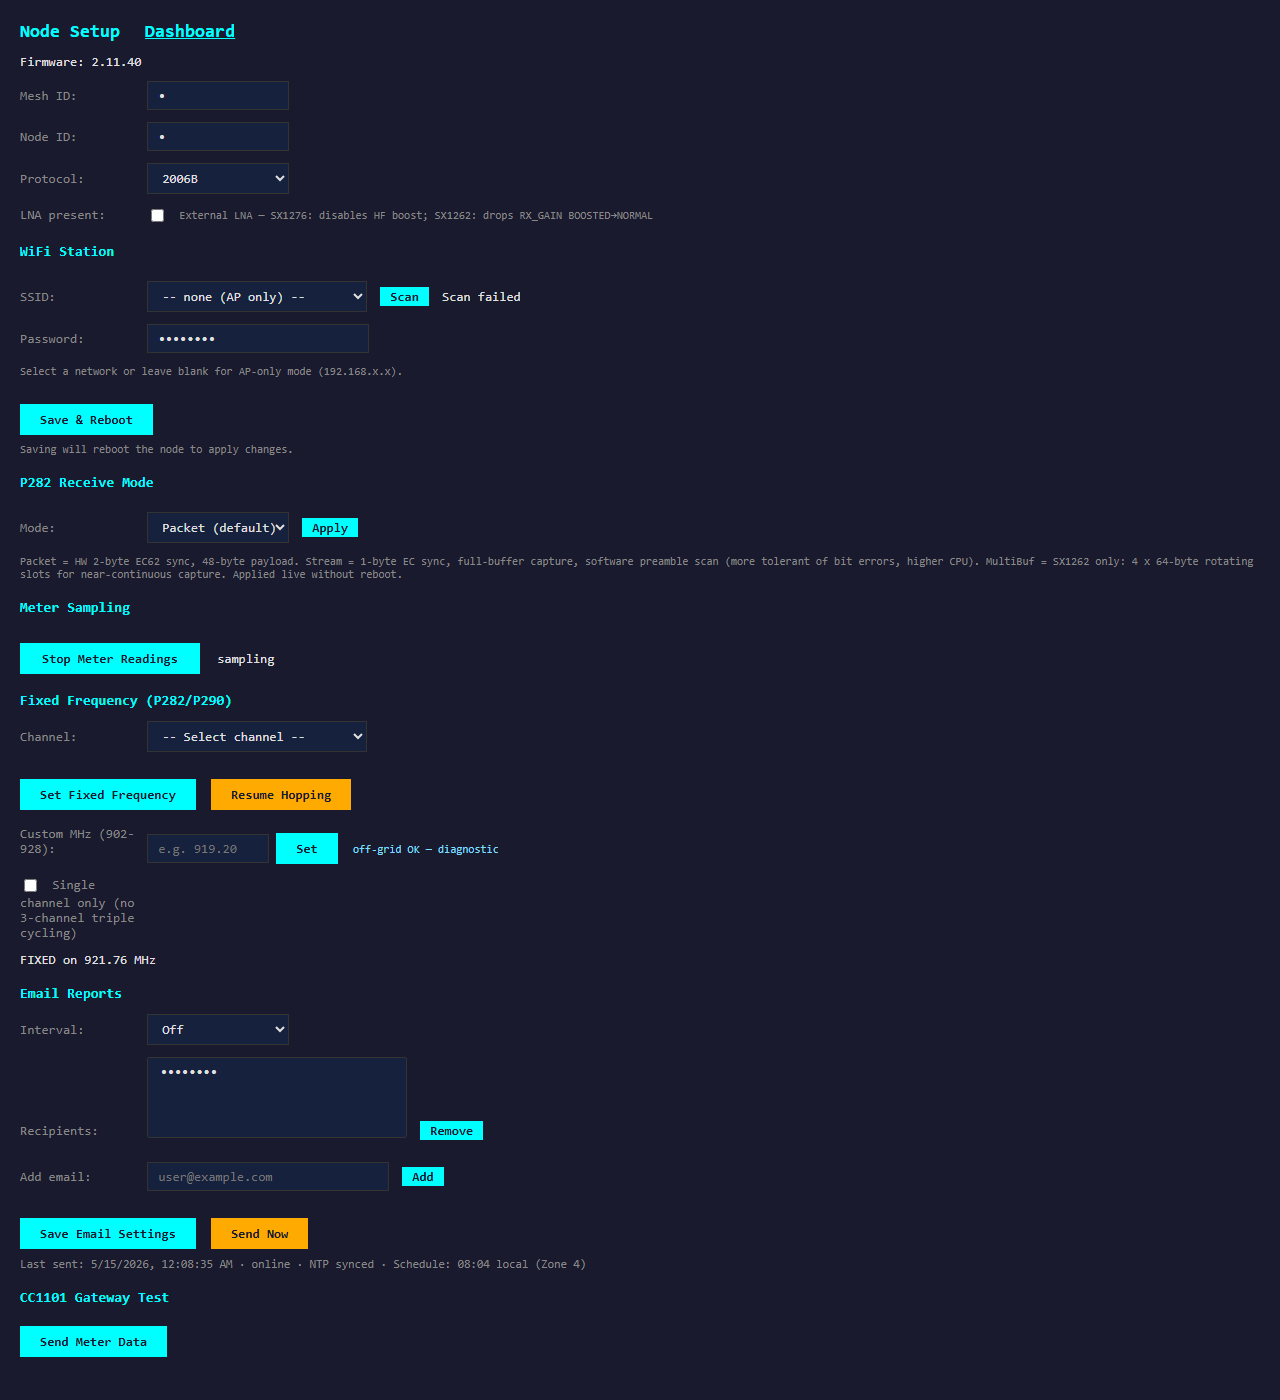
http://<node-ip>/setup · the Default Meter picker scopes the device; the red Clear Meter Data button wipes stored readings; the CC1101 Gateway Test section sends a reading or pings the gateway on demand · WiFi network name and password masked$120 / unit Buy a Node or request a quote
For agents
A structured spec of this device is available at /api/node.json. The page above is also annotated with schema.org/Product JSON-LD in <head>.